Virtually every organisation is sitting on a huge amount of data, and most want to do more with it. This might be to support anything from product and service development to day-to-day decision-making and strategic direction-setting.
Whether you have a vision of what you want to achieve with your data or feel overwhelmed by the possibilities and seeming complexity of how to better leverage it, data maturity models are your friend to guide you.
There are numerous of these out there, covering areas including data strategy, culture, governance, roles and skills and, of course, the technology. We often get asked to assist organisations of varying sizes with their data technology architectures, and below, we set out one of the three-stage journeys we recommend, which culminates with implementing master data management at the core of a fully governed enterprise data estate. Other approaches are available, notably enterprise data hubs with medallion architectures, which we’ll cover in a future piece.
Also note that the approach below is for those looking to bring together data from multiple source systems, but where data in the reports doesn’t need to be real-time. We’ll cover how to do this for up-to-the-second data in a separate blog.
Data technology maturity journey
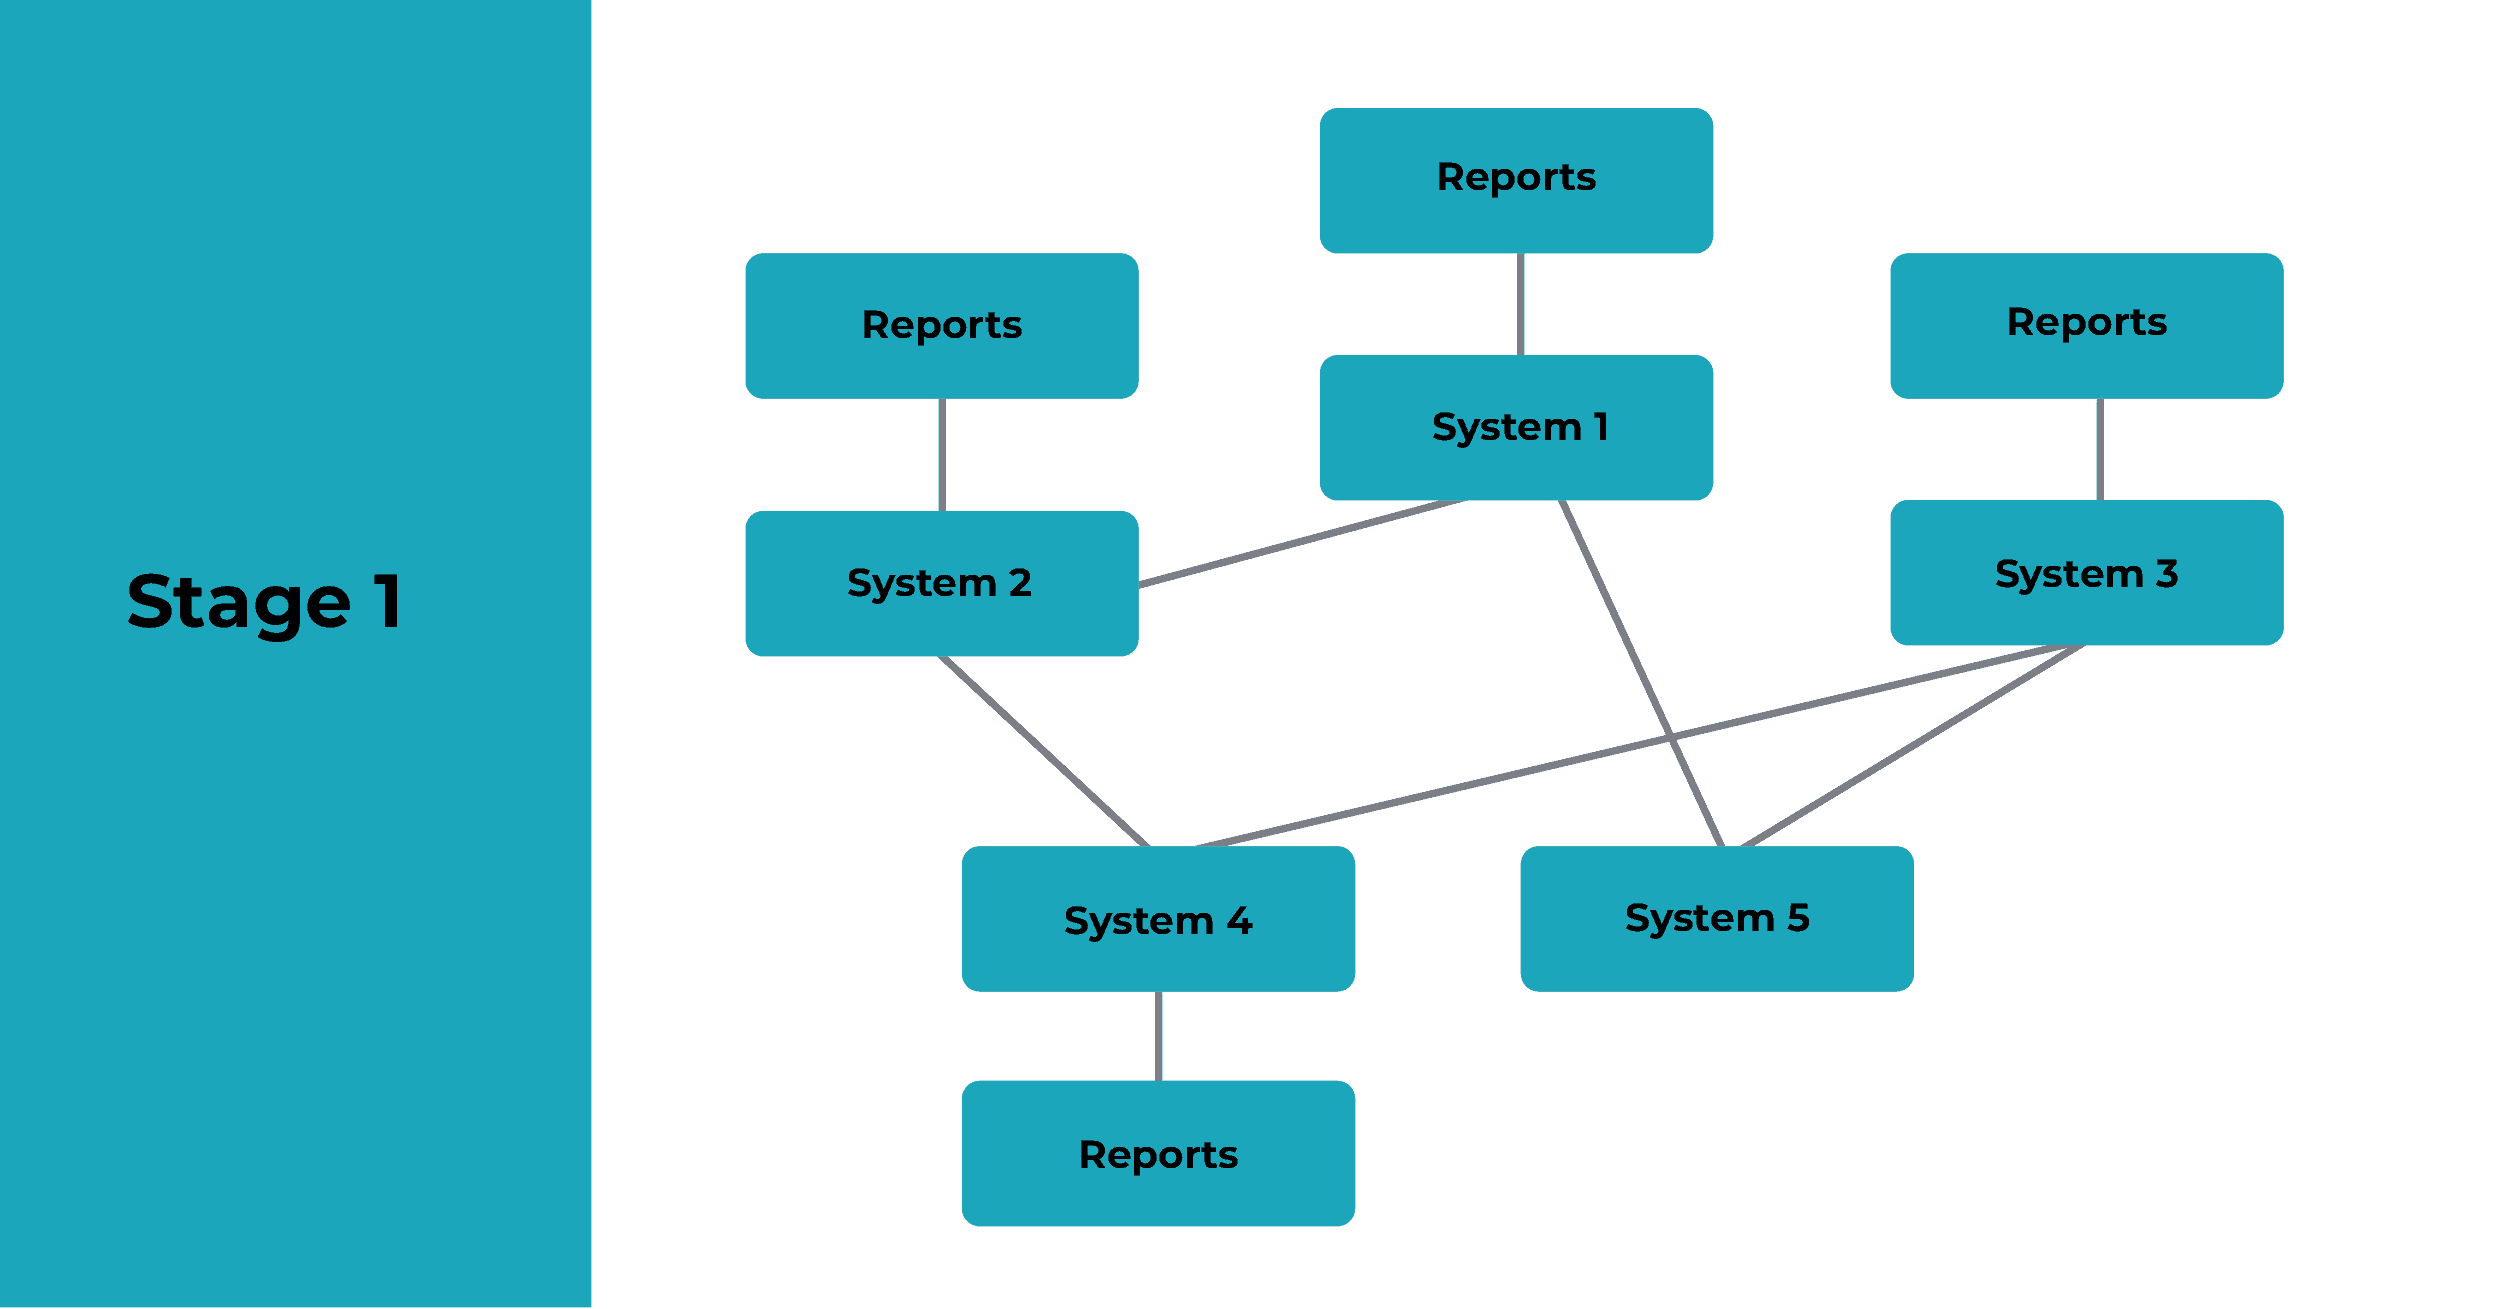
Stage 1: No centralised data repository, point-to-point integrations between systems
Organisational IT estates typically develop organically, with systems added one by one for specific purposes. Each will generally have its own store of data. Where information needs to be shared between applications, point-to-point integrations get put in. This creates an ever-more sophisticated and fragile web of links that needs to be maintained to safeguard the overall integrity of the ecosystem.
It also means data about key entities, such as customers and products, gets dispersed across multiple systems. As a result, there’s no single source of truth, and changes made to certain data will need to be manually replicated across multiple systems (which often doesn’t happen, resulting in a variety of problems).
Operational reports are generated direct from individual source systems, by the team using the application. Meanwhile, reports requiring data from multiple systems are created ad hoc, either by individuals, or an analyst team. The process of obtaining the necessary data, manually transforming it into the necessary shape, and then creating a custom report, is time-consuming. It also results in a proliferation of spreadsheets around the organisation, with no centralised governance or control of data quality.
Stage 2: Data warehouse or data lake, with pre-defined reports
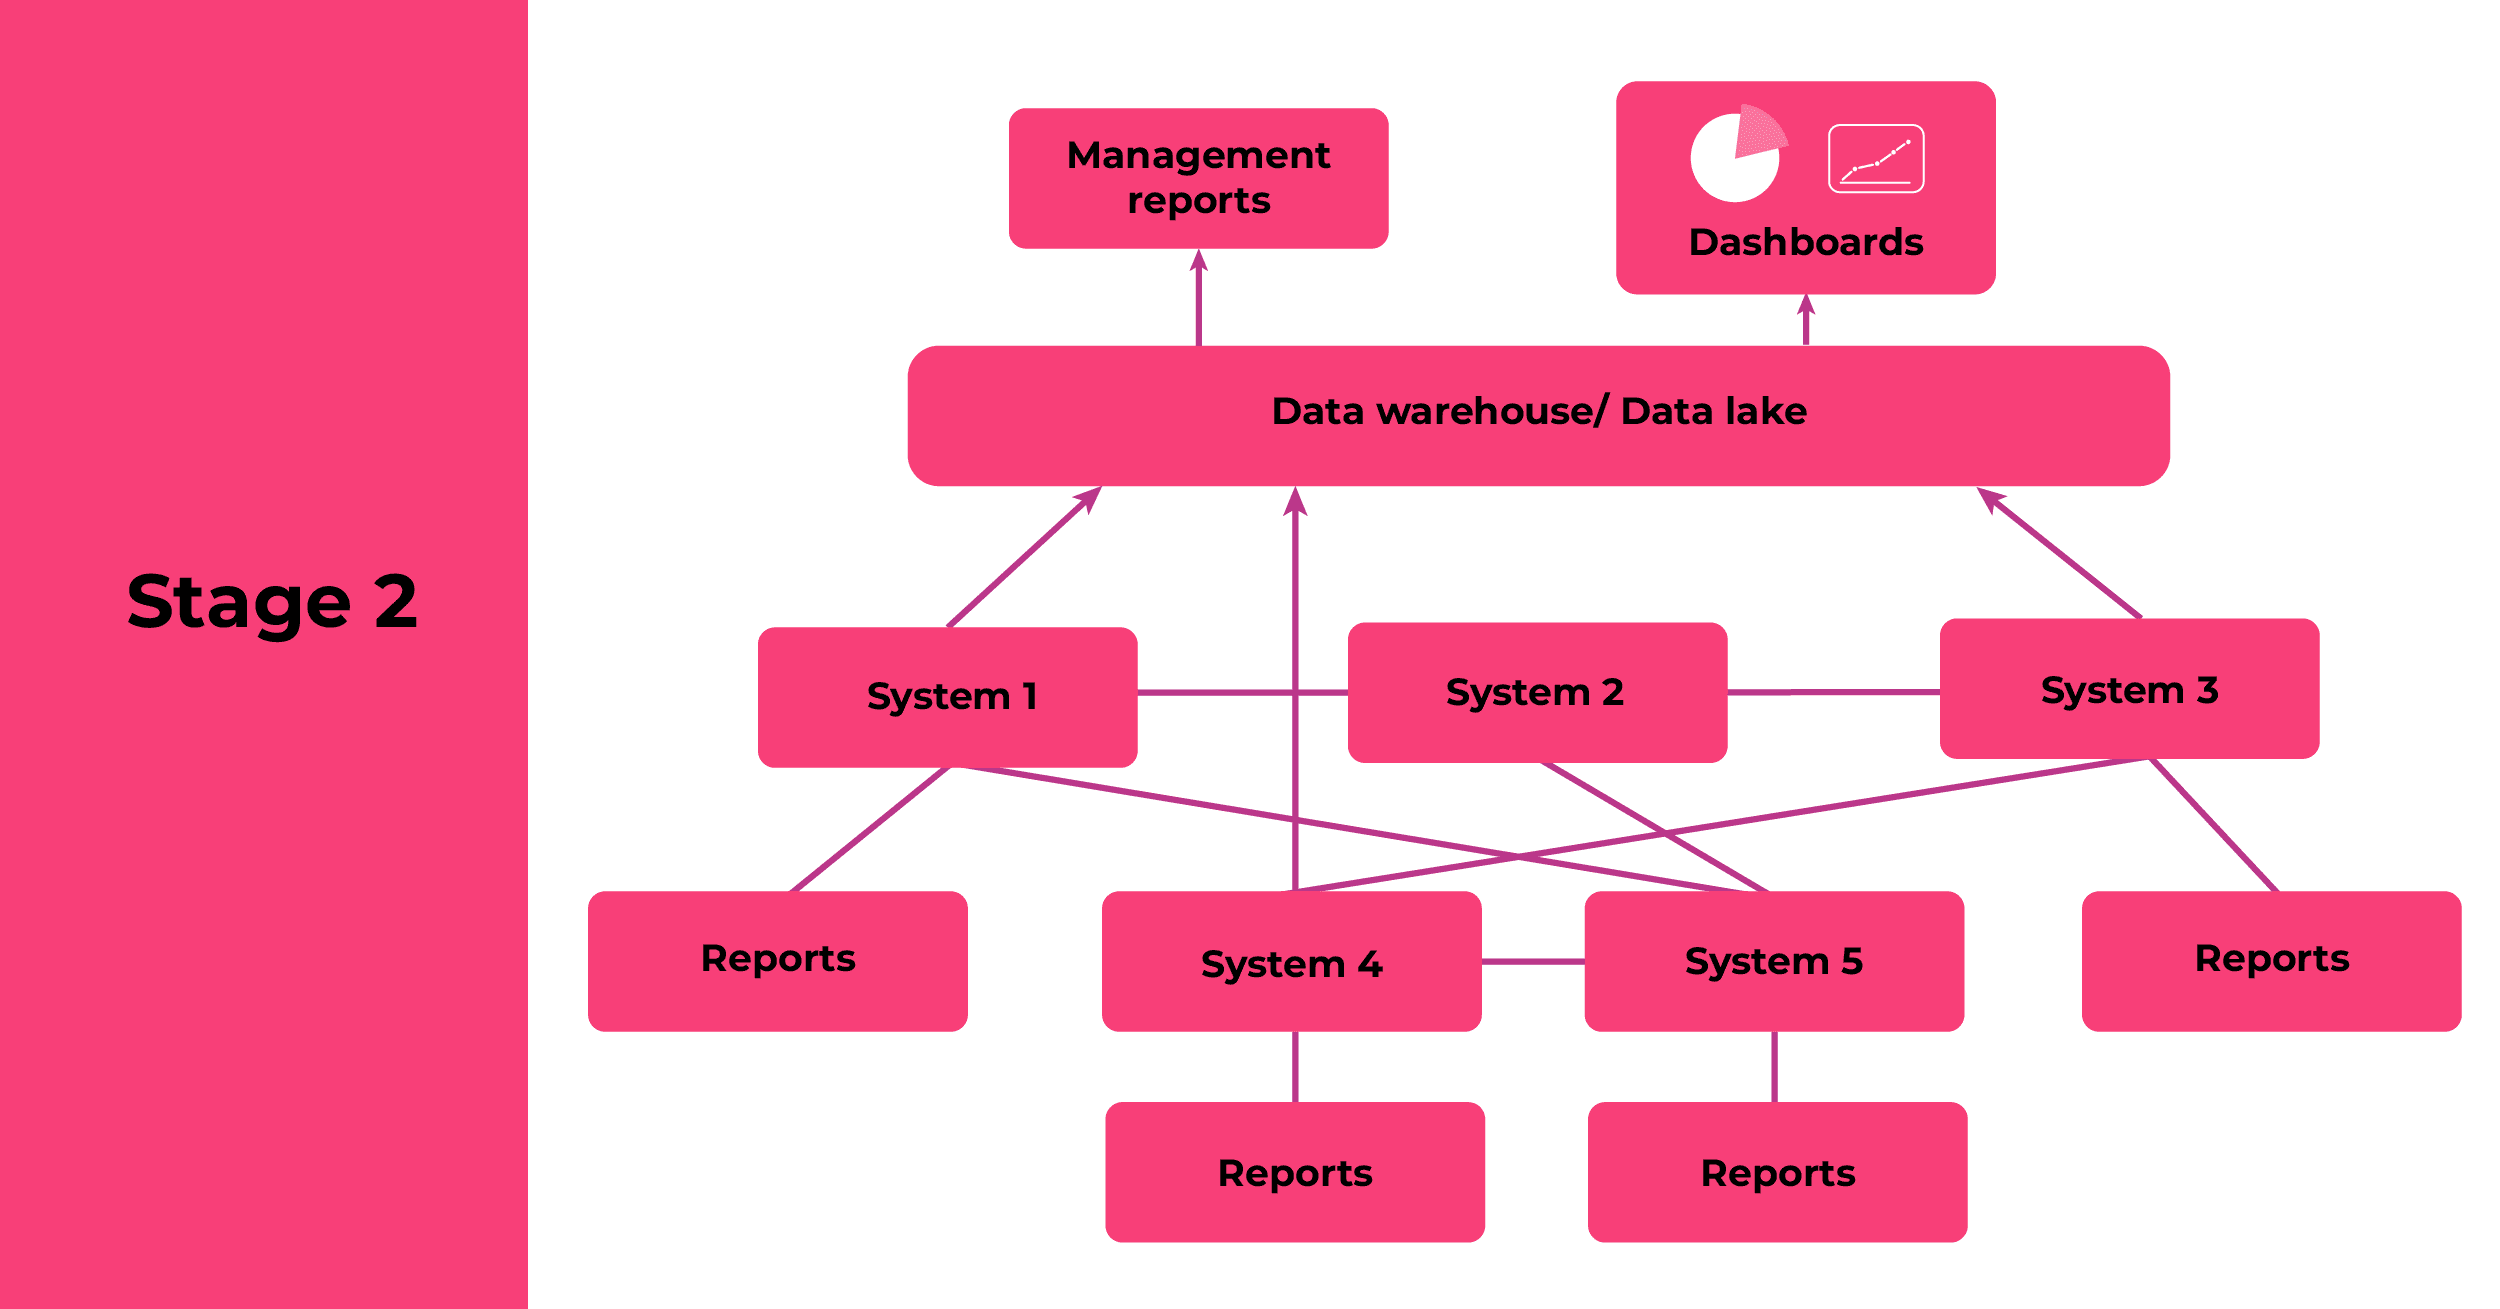
As the business matures, the pains associated with answering data-related questions ad hoc become more pronounced. This is where most organisations start exploring data warehouses and/or data lakes: repositories to bring together information from multiple sources for the purpose of management reporting and analytics. Operational reporting will typically continue to be done direct from the source systems.
A data warehouse is a store of highly structured data, designed with a specific reporting requirement in mind. This could be a traditional on-premises relational database with a data transformation layer, such as Microsoft SQL Server with SQL Server Integration Services (SSIS). It could also be a columnar database running in the cloud, such as Google BigQuery or Amazon Redshift. Analytics products such as Qlik, Microsoft Power BI or Tableau typically sit on top of these data warehouses.
A data lake will typically contain both structured and unstructured data, such as image files or PDFs, or be used when the precise nature of the questions to be asked of the data isn’t yet defined. Your choice will depend on what you need to store and the sorts of insights you’re looking to glean. All the main cloud providers have data lake offerings, including Google BigQuery, Azure Data Lake and Amazon Redshift.
Data usually only flows in one direction, from source systems into the data warehouse or lake. The warehouse/lake will be owned by a centralised data team, which will create a set of pre-defined reports for business users to access via a dashboarding or analytics tool. This reduces the workload on the data analyst team, while also providing a degree of governance around the data.
If you’re looking to move from stage one to stage two, identify some important reports that are currently painful or impossible to produce. Focus your initial work on delivering these successfully. Key areas of complexity are likely to be the extraction of data from source systems (which aren’t always designed with this in mind), and designing the transformations to get the data into the shape you need it. There are also various products you can use to accelerate your journey, including dbt, Fivetran and Stitch, as well as cloud-based services such as AWS Glue.
Stage 3: Fully governed data estate with self-service access to data
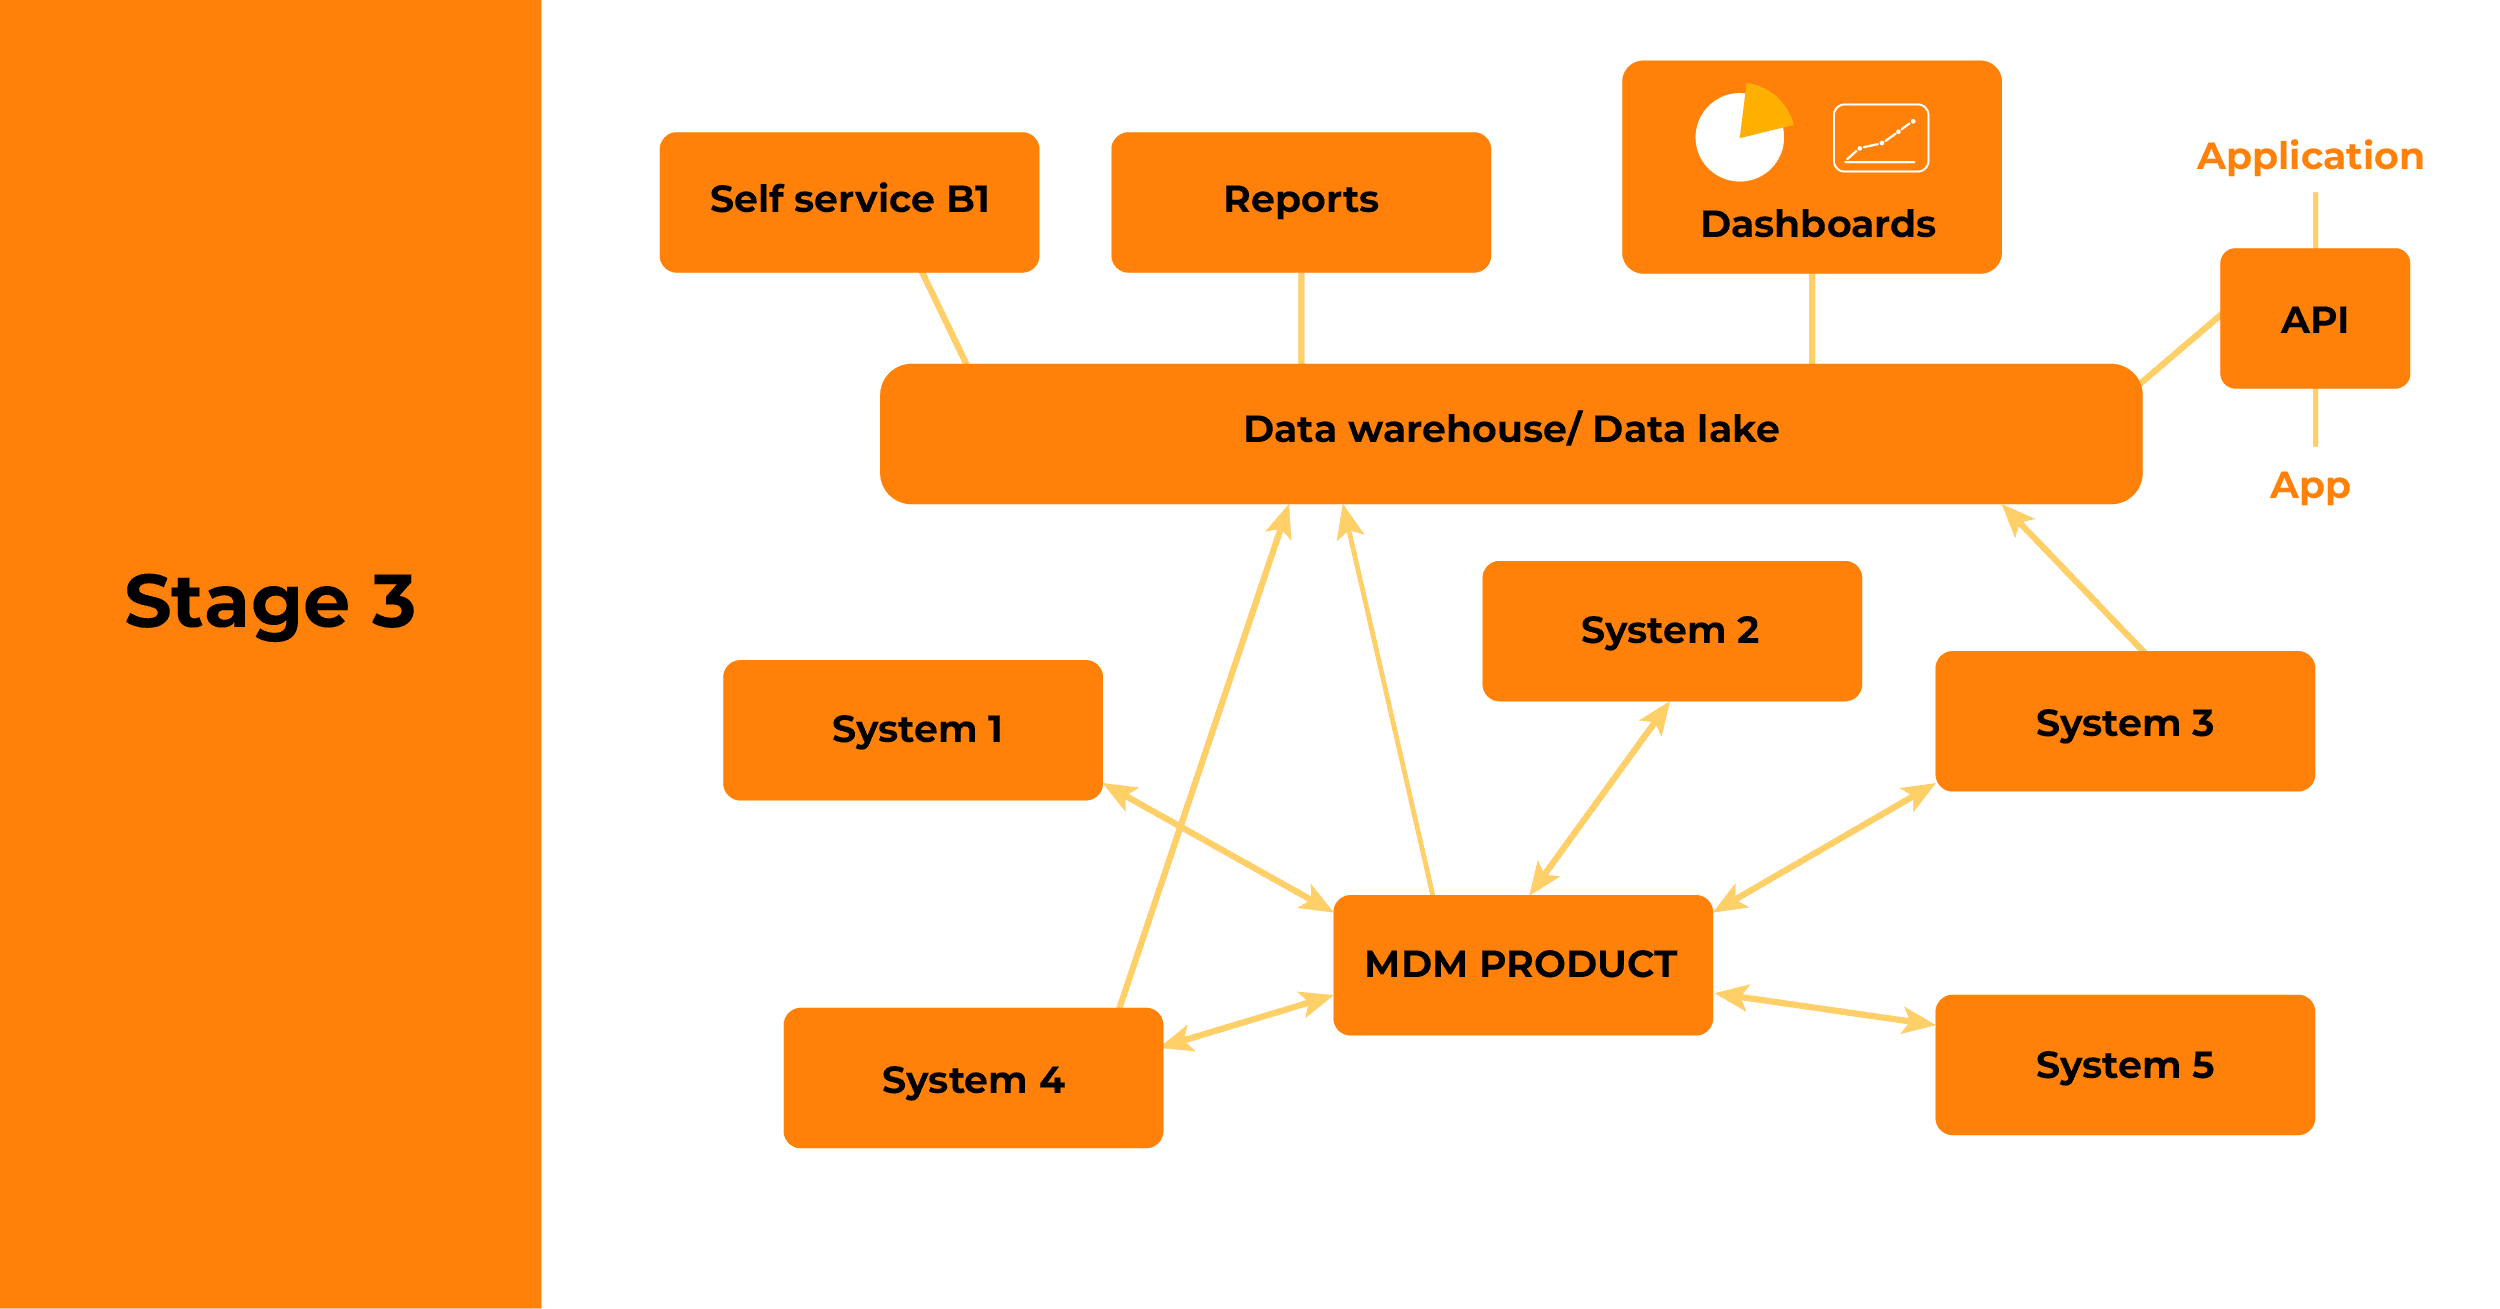
While stage two brings a variety of benefits, it doesn’t address the issues around syncing data between source systems and creating a ‘golden’ version of the truth. Equally, there often isn’t the capability for people to create their own reports, or to access data in the warehouse/lake directly via APIs.
It’s a desire to address these sorts of issues that sees organisations move towards a more fully fledged data estate, with master data management (MDM), self-service reporting and comprehensive governance.
The MDM capability will typically use a product to keep a golden record of key enterprise data, such as customer names and addresses. It syncs this, based on rules you set, with all connected systems, as well as your data warehouse or data lake. It means a change in one place is reflected elsewhere. The MDM product won’t usually hold operational information from each source system, such as a customer’s transactions. Consequently, you’ll still need a feed of data going from each operational system to the data warehouse for aggregated reporting, while operational reporting will continue to happen off the source systems directly.
Stage three will also see organisations put in place tools to enable self-service exploration, dashboarding and report-creation. This will generally use a commercial analytics product.
And of course, as your organisation’s data maturity increases and people make more use of data, it becomes essential to put in place appropriate governance. Who is responsible for each piece of data? What usage is permitted, and by who? What metadata do you need to associate with it? These and other questions need to be answered if you’re to protect your data, reputation and profits. This is a topic we’ll cover in a future blog.
Why the step-by-step approach is effective
We’ve found the iterative approach set out here to be a powerful way of securing buy-in from stakeholders and sponsors, by demonstrating value early and often. It also provides ample opportunity to tweak the direction of what you’re doing, ensuring the data estate you build genuinely supports the needs of your organisation and its customers, citizens or patients. In so doing, it becomes a virtuous circle, with people’s eyes being opened to the art of the possible, and then coming to you asking for the next iteration of your data capabilities.


