Kubernetes’ Horizontal Pod Autoscaler (HPA) is a powerful tool for automatically scaling workloads for many common use-cases, such as typical web applications. It’s often a bad fit, however, for batch workloads. Here we’ll look at a tool which is designed for this purpose, Kubernetes-based Event-Driven Autoscaling (KEDA), and how we use it to effortlessly and automatically scale up a batch image processing pipeline from zero to hundreds of nodes, allowing it handle batches of hundreds of terabytes of imaging data, in a matter of days.
Scenario: Migrating an image processing pipeline into the cloud
A client wanted to move their image processing pipeline from a bunch of on-premise virtual machines (VMs) into Google Cloud Platform. They wanted to handle significantly larger workloads, requiring the pipeline to efficiently scale up and down as necessary. Initially, we lifted the entire application into Google Kubernetes Engine, a managed Kubernetes solution.
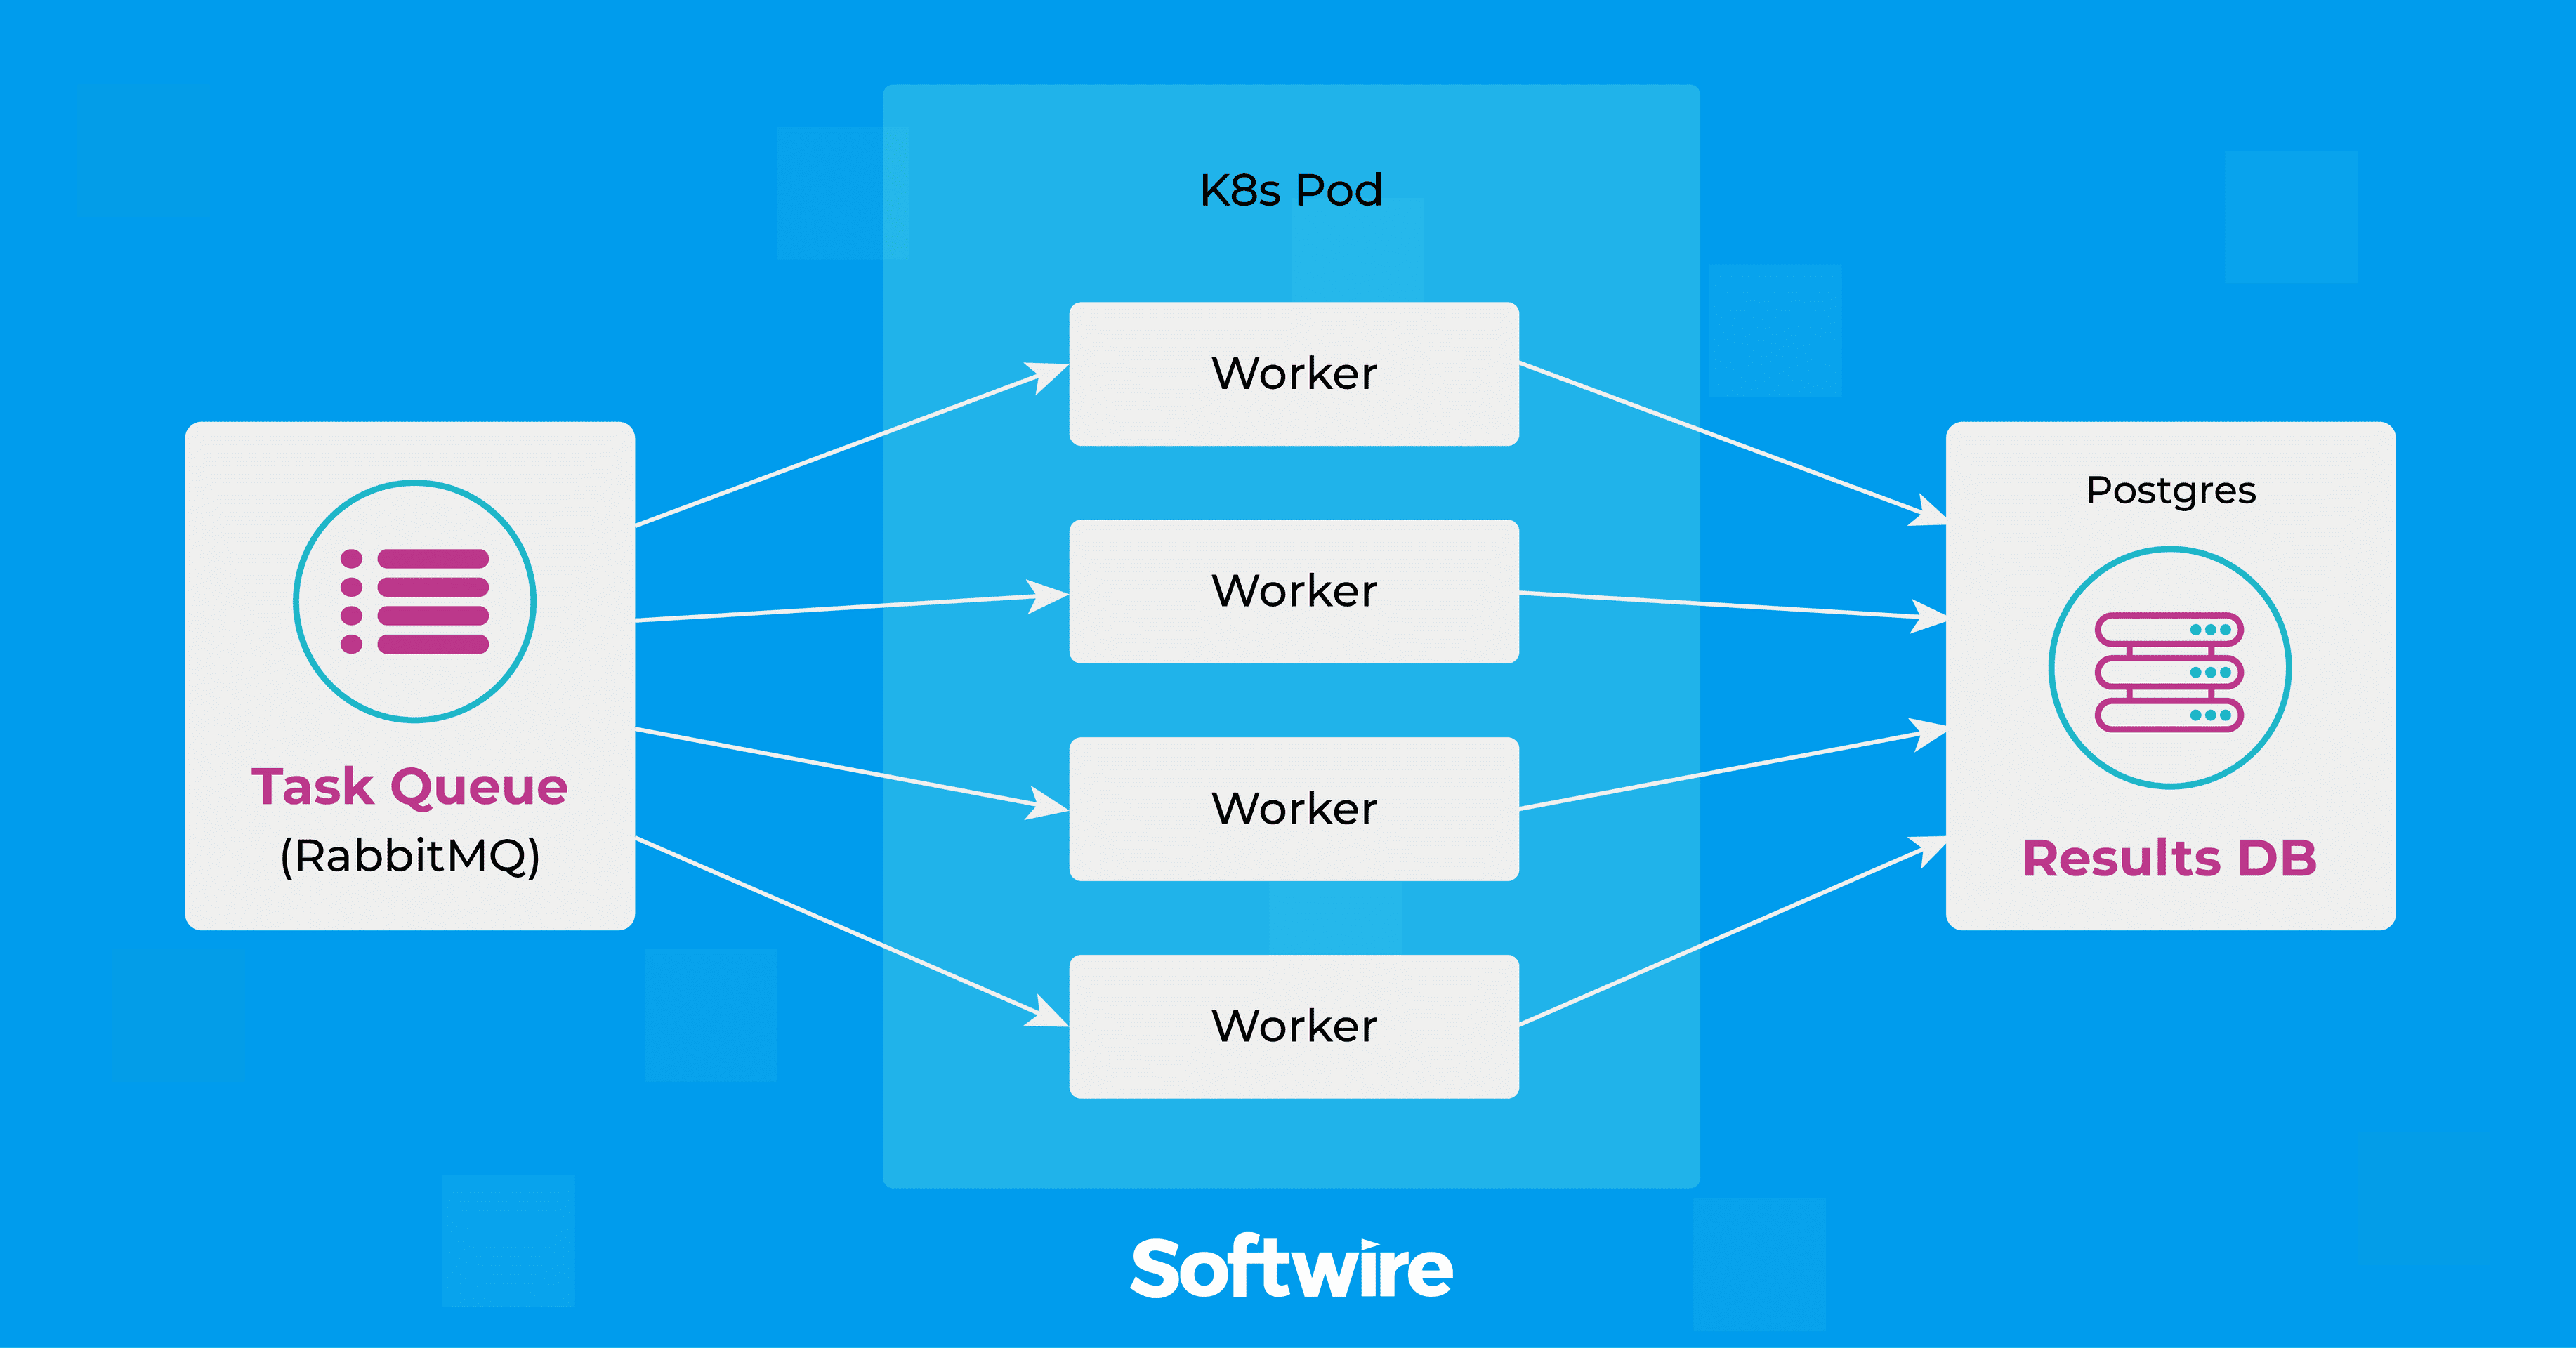
The pipeline is built as a task queue. The workers start-up, pull tasks off the queue and write the results to Google Cloud Storage (GCS) and to a PostgreSQL database. What we’d like is happen is, when there are a lot of items on the queue, more workers will be provisioned to process them.

This article looks at the tooling we used to achieve this scalability and some lessons we learnt along the way.
The limitations of Kubernetes’ built-in Horizontal Pod Autoscaler
Kubernetes already supports a form of autoscaling called Horizontal Pod Autoscaler (HPA). This is designed to scale up and down workloads based on metrics like CPU utilization.
A common usage of HPA is to host a HTTP API across a bunch of pods. This is particularly useful if the CPU utilisation is too high, because HPA can increase the number of pods serving your API, reducing the CPU utilisation on each pod.
The algorithm that HPA uses is nice and simple, operating on the ratio between desired metric value and current metric value:
desiredReplicas = ceil[currentReplicas * ( currentMetricValue / desiredMetricValue )]
In other words, you provide the desiredMetricValue and HPA will scale up or down to try and meet it.
A big limitation is that this doesn’t generalise well when it comes to queues, because HPA can’t scale to and from zero. Using the equation, we can see that HPA would never scale up if currentReplicas=0, but currentReplicas=0 is exactly what we’d want if the queue was empty.
KEDA provides an tailored solution that works
Among the solutions I explored, I found Kubernetes-based Event-driven Autoscaling (KEDA) would be the ideal answer to the zero problem. As described in its own support documentation, KEDA “allows for fine-grained autoscaling (including to/from zero) for event driven Kubernetes workloads”.
KEDA runs in your cluster as a Kubernetes operator, periodically monitoring a target metric, and then scaling up or down your deployment, as necessary. It supports a large variety of different metrics, from PostgreSQL queries to RabbitMQ queue size.
As opposed to the Kubernetes HPA algorithm example above, KEDA’s algorithm looks like this:
scalingMetric / numWorkers = desiredMetricValue
(There are a few other settings you could use, for example you can require a minimum or maximum number of workers to be running, but this is the key formula.)
As our image processing pipeline uses the RabbitMQ message broker, I set the metric to “RabbitMQ queue size” and asked KEDA to maintain desiredMetricValue = scalingMetric / numWorkers at a reasonable value, with an upper limit on numWorkers.
Setting this to desiredMetricValue=1 would mean there would always be a worker for each task in the queue. However, for short tasks, like those required in my project, desiredMetricValue=1 would be excessive, because any worker can process a couple of tasks in the time it takes to spin up a new worker. (A low value like 5 was better for us, but of course this depends on individual workloads.)
Three key learnings from integrating KEDA with Kubernetes
1. Be conscious of downstream effects
If you scale from a couple of workers to hundreds of workers, you need to be careful to look out for any downstream effects. You are likely to increase the load on many services which are touched by your pipeline – In our case, services impacted would be databases, storage, and networks.
Careful analysis, planning and testing of these is important because you don’t want to discover these issues in production. But even if you have planned incredibly carefully, I would still recommend scaling up gradually, just in case.
For example, we use PostgreSQL to store some of the results of our image processing: Each worker creates a new connection to PostgreSQL when it finished its task and needed to store the results. The PostgreSQL architecture forks a new process for every connection, which comes with associated resource costs of up to 15MB per connection, so this is going to add up quickly when you have hundreds of connections. (A simple solution that countered this was to add a connection pooler like pgbouncer.)
Using managed cloud services can be an advantage here – the levels of load we were putting on GCS are not significant from Google’s perspective! You should still be careful not to hit any quotas though.
2. Consistently monitor your signals
Monitoring is crucial in any production system, but when you’re scaling up to using a significant numbers of machines, you’re almost guaranteed to start experiencing some problems you’ve not seen before. (Ever wondered what really happens when a Kubernetes container runs out of memory?)
Even if you scale up slowly, as you should, without proper monitoring, you could tip part of your system over the edge without warning.
According to Google’s site reliability engineering (SRE), there are Four Golden Signals of monitoring:
- Latency – The time it takes to service a request
- Traffic – The measure of how much demand is being placed on your system
- Errors – The rate of requests that fail, either explicitly, implicitly, or by policy
- Saturation – How ‘full’ your service is
(While the SRE team described them in relation to an application serving HTTP requests, they do generalise quite well to a task queue architecture.)
Error rates and saturation are obvious metrics to keep an eye on (the database example above initially manifests as a memory saturation problem). But it’s also worth paying close attention to overall task completion time, and to retry rates, as these can provide an early warning system that one of the components in your system is starting to strain.
3. Consider whether your jobs are short or long running
It’s worth pointing out that the architecture I’ve described here, with long-running worker pods pulling jobs off the queue, is well suited to short jobs. However, it is poorly suited to long-running jobs and I’ll explain why.
Take a look at the earlier KEDA algorithm as an example. Let’s say that we’ve asked KEDA to maintain the ratio of queueLength / numWorkers = 1. We expect KEDA to maintain as many replicas as there are messages on the queue, so if we have 5 messages on the queue, we expect 5 replicas. What happens when one task completes? KEDA will notice that queue_length is now 4 and begin to scale down the deployment to 4.
But Kubernetes does not know (or care!) which pod is no longer busy. It will simply choose one to terminate, which means that now you have an 80% chance that you’ll interrupt a running job that you didn’t want to interrupt.
This isn’t a problem for shorter running jobs, because Kubernetes doesn’t just kill a pod without warning – It will first send the pod a SIGTERM, after which, the pod has the configurable terminationGracePeriodSeconds to finish what it’s doing and exit cleanly.
For long-running jobs, you could be better off using KEDA to create Kubernetes jobs (one for each element on the queue) instead.
Migrating your workloads to the cloud
Moving your organisations applications to the cloud can bring huge advantages, but it is not a task to be taken lightly. A pure lift-and-shift is often not the right approach – read our insights article, ‘Why you shouldn’t lift-and-shift legacy software to the cloud (and what to do instead)’ for more information.
A more careful approach is needed. Developers should identify key problems with an existing on-premise solution and how they might be mitigated in the cloud, such as replacing vertical with horizontal scaling, or by migrating some elements of your application to more managed solutions like a cloud storage.
And remember, you’re not alone – we ally ourselves with teams and developers to support them make the right decisions and setups. To explore more about how you can use cloud as a force for good in your organisation, talk to one of our Cloud consultants or do a Cloud performance review to check on your progress.


